Query Language
MPC provides a general way of computing a function by several parties potentially allowing any computation. However, not all the computations are feasible to use in practice due to performance considerations. The query language exposes carefully chosen functions for statistical analysis. More functions can be added to the language depending on use cases and after the detailed performance cost estimation.
A single analysis may include one or more calculations (queries). Each query consists of a filter expression and one or more functions that are applied to the input data after filtering.
Example
| age | salary | employed | gender |
|---|---|---|---|
| 20 | 10000 | 2025-12-15 | Male |
| 18 | 12000 | 2023-06-01 | Female |
| 78 | 9900 | 1971-09-01 | Male |
| 67 | 15000 | 1977-02-15 | Female |
Compute the average salary for all employees older than 25
Filter:   age > 25            Result: 2/4 (2 of 4 rows)
Function: mean(salary)        Result: 12450
Info
This document uses variable to correspond to the name of a column in a dataset.
Types
Both filter expressions and functions are typed. The types of variables and constants must match, according to the filter operations, and expected function parameters.
The existing types include
boolean: Represents something that istrueorfalse- Accepted
trueliterals:true,positive,yes. - Accepted
falseliterals:false,negative,no.
- Accepted
int: A whole number- E.g.: 1, 42, 198011
decimal: A decimal number.- Uses
.as decimal separator. - E.g.: 6.41, 95.156, 1101.5
- Uses
date: An ISO 8601 formatted date.- E.g.: 2025-04-22, 1966-12-03
enum: A dataset defined enumeration over different variants.- Written with
::between enum name and chosen variant. - E.g.:
Gender::Female
- Written with
list: An aggregate of one of the previous types.- Lists are written as comma-separated values in square brackets, e.g.:
[1, 2, 5]is a list of integers.
- Lists are written as comma-separated values in square brackets, e.g.:
Filter expressions
A filter expression consists of one or more comparison expressions connected with logical AND and OR operators. A filter expression can also be negated using logical NOT.
A comparison expression can use arithmetic in its subexpressions, but a top-level arithmetic expression is not valid.
Each comparison expression consists of a variable (a column from the data set), a comparison operation and a value to compare the variable to.
| Operations | Symbols | Accepted Operand Types | Resulting type |
|---|---|---|---|
| Comparison | <, >, <=, >=, ==, != |
int, decimal, date |
boolean |
| Enum comparison | ==, != |
enum |
boolean |
| Logical | &, |, ! |
boolean |
boolean |
| Arithmetic | +, -, *, /, abs |
int, decimal |
int, decimal |
| Date arithmetic | +, - |
int, date |
date |
| Special functions | missing |
any | boolean |
Only enums of the same enum name can be compared with each other.
The following date arithmetic expressions are valid:
date + int- Compute a future date, where the integer specifies how many days in the future the result is, compared to the input date.date - int- Compute a past date, where the integer specifies how many days in the past the result is, compared to the input date.date - date- Computes the difference in days between the two dates. Note that if the right date is later in time, the result will be negative. Seeabs.
Special functions
The following 'non-standard' functions are available to use in filter expressions:
missing(variable)- Takes as input a variable of any type, and returns true if the value of the variable is missing. A variable can be missing, if e.g. a left-join was performed, and a row from the left table was added without a match from the right table.
Examples
Find all employees with a salary between 10000 and 20000 or younger than 30.
(salary >= 10000 & salary <= 20000) | age < 30
Find all employees with a salary outside the interval between 10000 and 20000 (note the negation
operation !)
!(salary >= 10000 & salary <= 20000)
Find all employees that were hired within a year from a specific date.
abs(2024-01-01 - employed) < 365
Find all female employees.
gender == Gender::Female
An illegal filter, as the types do not match.
salary >= 2024-05-15
An illegal filter, the top-expression is arithmetic, which is not allowed.
age + 30
An illegal filter, as the enum types do not match.
gender == BloodType::Aplus
Functions
min(variable)
Compute minimum of all values of variable.
Arguments:
- a variable corresponding to a column name
- Must be of type
int,decimalordate
- Must be of type
Example: min(age) = 18, for the example dataset
Warning
The min function reveals the exact value of a single data point in the data set. Whether to use this function should be determined on a case-by-case basis.
max(variable)
Compute maximum of all values of variable.
Arguments:
- a variable corresponding to a column name
- Must be of type
int,decimalordate
- Must be of type
Example: max(age) = 78, for the example dataset
Warning
The max function reveals the exact value of a single data point in the data set. Whether to use this function should be determined on a case-by-case basis.
mean(variable)
Compute the sample mean (the average value).
Arguments:
- a variable corresponding to a column name
- Must be of type
intordecimal
- Must be of type
Example: mean(salary) = 11725, for the example dataset
variance(variable)
Compute the sample variance. The variance characterizes the average degree to which each point differs from the mean.
Arguments:
- a variable corresponding to a column name
- Must be of type
intordecimal
- Must be of type
Example: variance(age) ≈ 974.9167, for the example dataset
standardDeviation(variable)
Compute the sample standard deviation as the square root of the sample variance. The standard deviation characterizes how far values are spread out from the mean (average value).
Arguments:
- a variable corresponding to a column name
- Must be of type
intordecimal
- Must be of type
Example: standardDeviation(age) ≈ 31.2237, for the example dataset
sum(variable)
Compute the sum of all values of the given variable.
Arguments:
- a variable corresponding to a column name
- Must be of type
intordecimal
- Must be of type
Example: sum(salary) = 46900, for the example dataset
prevalence(filter)
Compute prevalence. Prevalence is the percentage of the dataset matching the filter criteria.
Arguments:
- A filter expression, e.g. age > 70
Example: prevalence(age > 70) = 25%, for the example dataset
count()
Compute number of rows after applying a filter expression.
Arguments: none
Example: filtering the example dataset with age > 18 and then computing count()
gives 3.
chiTest(variable, [NUM], [INT])
Compute Chi-square test.
Chi-square (χ²) test is used to test whether the observed data corresponds to some expected data. E.g. observations correspond to some theoretical probability distribution, or two observed variables are independent of each other (for example, the fact that people buy snacks or not is independent of the type of the movie they attend).
Arguments:
- a variable corresponding to a column name
- Must be of type
intordecimal
- Must be of type
- a list of integers or a list of decimals, corresponding to histogram buckets
- a list of integers corresponding to expected values for each bucket
histogram(variable, [INT])
Compute a one-dimensional histogram.
Arguments:
- a variable corresponding to a column name
- Must be of type
intordecimal
- Must be of type
- a list of integers - soft (less-or-equal) - upper bounds of the histogram buckets.
Output: count of elements in each bucket; the last count corresponds to the elements larger than
the last bound in the
input list of bounds. Note that the count for any of the buckets is below k (the anonymity
threshold), the whole
result is <k, and it is not possible to see for which bucket the count was below the threshold.
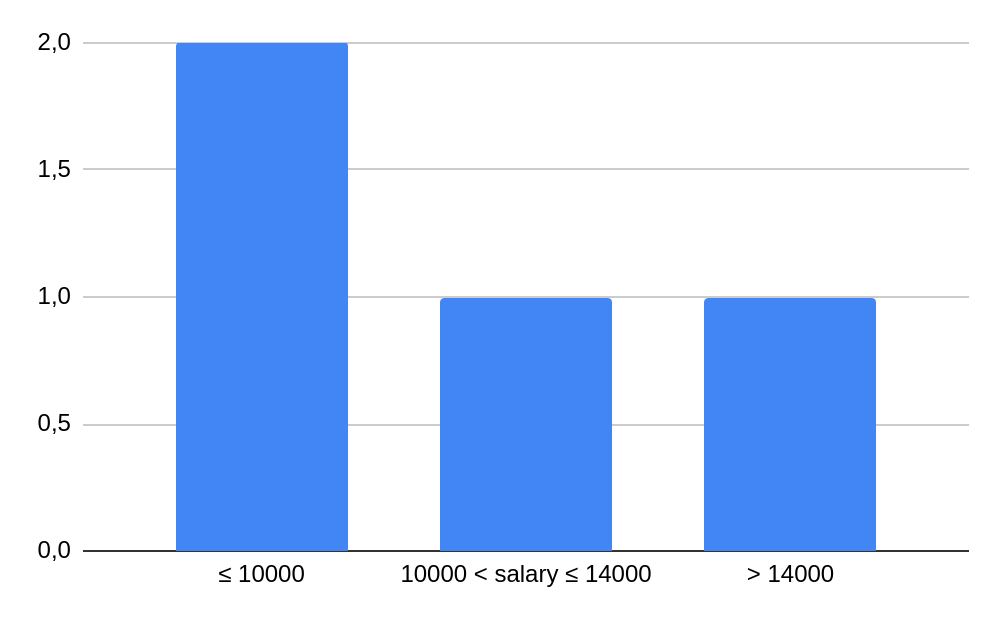
Example: histogram(salary, [10000, 14000]) returns [2, 1, 1], for the example dataset. The buckets:
salary ≤ 10000, 10000 < salary ≤ 14000, salary > 14000. The histogram can be visualized in the following way:
tTest(variable, NUM)
Compute the test statistics for a Student's t-test for the hypothesis that the mean (average) of the sample is equal to the given value. For example, one can test a hypothesis that, on average, protein bars have 20 grams of protein.
Arguments:
- a variable corresponding to a column name
- a number (possibly decimal) corresponding to the
Info
Lists are written as comma-separated numbers in square brackets, e.g: [1,2,3.6]
coxRegression(time, event, covariates...)
A proportional hazards model for relating the survival time of some subject to one or more covariates. It estimates the coefficients of the Cox model on the given data using gradient descent.
Arguments:
- an integer time variable for how long the subject has survived.
- a boolean variable indicating whether the event of interest was observed for the subject (
true), as opposed to the observation being censored — i.e. it ended before any event occurred (false). - a variable length list of covariate variables to test whether they have an influence on the survival rate.
Output:
For an analysis with n covariates, it has 2n+1 outputs.
- the first n values are the model coefficients (log hazard ratios) for each covariate. The larger a coefficient's magnitude, the stronger that covariate's effect on the hazard; a positive value increases the hazard (shortening expected survival) and a negative value decreases it (lengthening survival).
- the next n values are the standard errors for each of the covariates.
- the last value is a partial likelihood ratio test of the model to check how well the covariates fit the model.